
Fat Loss vs Weight Loss: What's the Difference and Why It Matters
Fat loss vs weight loss isn't semantics — the difference determines whether you end up lean or skinny-fat. Here's how to tell them apart and target fat.
The bathroom scale is the most misleading feedback tool in fitness. It tells you one number — and that number lumps together muscle, fat, water, glycogen, and the contents of your gut as if they were the same thing. That's why fat loss vs weight loss is not a word game: two people can both drop 15 pounds and end up with completely different bodies, one leaner and stronger, the other smaller but softer. This guide breaks down what the scale actually measures, why muscle and fat behave so differently, and how to target fat specifically so your effort shows up in the mirror and not just the digits.
Key Takeaways
- Body composition — not scale weight — determines how you look. Two people at the same bodyweight can look completely different depending on their fat-to-muscle ratio.
- A pound of fat takes up roughly 18% more volume than a pound of muscle, which is why scale weight can stay flat while your waist shrinks.
- The scale swings 3–5 lb per day from water, glycogen, sodium, and hormones — none of which is fat change.
- DEXA scans are the gold standard for measuring fat vs lean mass (±1–2% error); standard bioimpedance scales can swing ±3–5% based on hydration alone.
- You can lose fat while gaining muscle simultaneously — known as body recomposition — but it is most reliable in beginners, people returning from a layoff, and those with higher body fat percentages.
- Protein at 0.7–1.0 g per pound of bodyweight is the single highest-leverage dietary variable for preserving muscle mass during a calorie deficit.
What the Scale Actually Measures
When you step on a standard bathroom scale, it reports total body mass — every tissue and fluid in your body, weighed as a single lump sum. In a typical adult, that mass breaks down roughly like this:
- Water: 55–65% of total body weight
- Muscle (lean tissue): 30–40%
- Fat: 10–35% (highly variable)
- Bone, organs, glycogen, gut contents: the remainder
The problem is that most of those components fluctuate by the hour. A single gram of stored carbohydrate (glycogen) binds roughly 3 grams of water, so a carb-heavy meal can add 2–4 lb of scale weight overnight with zero fat change. Sodium shifts, menstrual cycles, hard training sessions, and even a poor night's sleep can swing the number by 3–5 lb in either direction.
A 2016 study in the American Journal of Clinical Nutrition tracked daily body weight in 40 adults over four weeks and found average day-to-day fluctuations of 1.5–2.2% of body weight — about 3 lb for a 170 lb person — with no correlation to actual fat change. In other words, the scale is mostly noise on any single day.
This matters because the goal of a diet isn't to lower a number. It's to reduce fat while keeping (or ideally building) muscle. Understanding fat loss vs weight loss starts with accepting that the scale alone cannot tell you which one you're doing.
Muscle vs Fat: Same Weight, Very Different Bodies
A pound of muscle weighs exactly the same as a pound of fat. One pound is one pound — that part is not up for debate. But they occupy wildly different amounts of space on your body, which is why two people at the same weight can look nothing alike.
- Muscle density: ~1.06 g/mL
- Fat density: ~0.9 g/mL
That 18% density gap means a pound of fat takes up roughly 18% more volume than a pound of muscle. Visualized: a pound of muscle is about the size of a small fist; a pound of fat is closer to a softball. Now stack that difference across 10–20 pounds and the reason your "before" and "after" photos can shift dramatically at the same bodyweight becomes obvious.
A 2015 paper in the Journal of Strength and Conditioning Research followed 36 previously sedentary adults through a 12-week program. The resistance-training group ended the study 0.5 lb heavier on the scale but lost an average of 1.75 inches off the waist. The scale said "no progress." The tape measure said "major progress." Body composition — the ratio of fat to lean mass — is the variable that actually changes how you look, move, and perform.
Why Cardio-Only Dieters "Lose Weight but Still Look Soft"
If you've ever watched someone drop 20 pounds on a treadmill-and-salad plan and still look flabby at the finish line, you've seen the fat loss vs weight loss problem in the wild. Weight came off. Fat came off. But so did muscle — and without muscle underneath, skin doesn't tighten and shape doesn't emerge.
The landmark citation here is Willis et al., 2013, published in the Journal of Applied Physiology. The researchers randomized 234 overweight adults to one of three 8-month programs:
| Group | Total weight lost | Fat lost | Lean mass lost | |-------|-------------------|----------|-----------------| | Aerobic only (cardio) | -3.9 lb | -3.5 lb | -0.4 lb | | Resistance only (lifting) | +3.1 lb (gain) | -1.1 lb | +4.2 lb (gain) | | Combined (cardio + lifting) | -3.3 lb | -4.6 lb | +1.3 lb (gain) |
The cardio-only group lost the most scale weight but also sacrificed lean tissue. The combined group lost more fat while adding a pound of muscle — a better outcome for body composition despite a smaller number on the scale. This is the "skinny-fat" phenomenon in a single chart: cardio alone pulls mass off the body indiscriminately, and the muscle loss undermines the visual payoff.
A follow-up 2017 meta-analysis in Sports Medicine reviewed 58 weight-loss trials and found that adding resistance work to a calorie deficit preserved 93% of lean mass, compared to just 69% preservation in cardio-only groups — at identical total weight loss. Every pound of muscle you keep is a pound of shape, strength, and long-term metabolic rate you don't give back.
The LBE Body Composition Clarity Framework
Most people fail their cut because they manage the wrong number. The LBE Framework — Lever, Build, Evidence — fixes that:
1. Lever (choose the right deficit strategy) A 300–500 kcal/day deficit is the productive zone. Below 300 kcal, fat loss stalls. Above 700 kcal, muscle loss accelerates disproportionately.
2. Build (protect lean mass actively) Protein and resistance training are non-negotiable inputs. Without them, weight loss and fat loss diverge immediately.
3. Evidence (measure what actually changes) Track waist circumference and progress photos, not just scale weight. Use DEXA or calipers for objective body composition data at the start and end of each 12-week block.
Apply all three levers and the scale number becomes secondary. Miss any one of them and the scale number is the only thing that changes.
Fat Loss vs Weight Loss: Deficit Strategies Compared
Different approaches to a calorie deficit produce very different body composition outcomes. This table maps the most common strategies to what they actually change:
| Strategy | Deficit size | Weight lost (12 wks) | Fat lost | Muscle preserved | Best for | |----------|-------------|----------------------|----------|-----------------|---------| | Aggressive cut (very low cal) | >700 kcal/day | High (10–15 lb) | Moderate | Poor (60–70%) | Pre-contest powerlifters under coach supervision | | Standard cut (protein + lifting) | 300–500 kcal/day | Moderate (6–10 lb) | High | Excellent (90–95%) | Most people; best fat-to-muscle ratio | | Cardio-only deficit | 300–500 kcal/day | Moderate (5–8 lb) | Moderate | Poor (65–75%) | Short-term weight loss only; not body composition | | Recomposition (maintenance cals) | ~0 kcal deficit | Minimal or zero | Moderate | Gains possible | Beginners, returning trainees, higher body fat | | Mini-cut cycles (2–3 wks) | 400–600 kcal/day | Low per cycle | High relative | Good (85–90%) | Experienced lifters who want to preserve strength |
The takeaway: the number on the scale after 12 weeks tells you almost nothing without knowing which row of this table you were in.
How to Actually Target Fat (Not Just Weight)
Targeting fat specifically comes down to three levers, in this order: protein, resistance training, and a modest calorie deficit.
- Protein intake. Aim for 0.7–1.0 g of protein per pound of bodyweight daily during a cut. A 2020 meta-analysis in the British Journal of Sports Medicine pooled 49 studies and found that protein intakes above 1.6 g/kg (~0.73 g/lb) significantly preserved lean mass during a deficit versus lower intakes.
- Lift heavy, 3–4x per week. Compound movements — squats, deadlifts, rows, presses, pull-ups — create the mechanical tension that tells your body "keep this muscle, you need it." Without that signal during a deficit, the body will catabolize muscle for energy.
- Modest deficit: 300–500 kcal/day below maintenance. Aggressive deficits (>700 kcal/day) double your rate of muscle loss per pound of fat lost, per a 2014 study in the International Journal of Sport Nutrition and Exercise Metabolism. Slower is not just kinder — it's more efficient on body composition.
Skip any of the three and the scale may still drop, but the ratio of fat-to-muscle coming off will shift against you.
Tracking Activity: Why a Fitness Tracker Helps During a Cut
One underrated mistake during fat loss phases is underestimating how much total daily movement drops when calories fall. Fatigue and hunger naturally suppress non-exercise activity thermogenesis (NEAT) — the fidgeting, walking, and incidental movement that can account for 300–500 kcal/day in active people. When NEAT collapses, your actual deficit shrinks without you realizing it.
A fitness tracker closes that blind spot. Tracking daily step count is not about earning food — it's about keeping your baseline activity honest so that the deficit you calculated on paper stays real. Aim to hold steps consistent week-over-week during a cut rather than letting them drift down as fatigue builds.

Amazon · Affiliate
Fitbit Charge 6 Fitness Tracker
4.4
Built-in GPS, heart rate monitoring, sleep tracking, and 40+ exercise modes. Google Maps and Wallet integration.
$100–$160Check Price on Amazon
Fitbit's trackers give you a reliable daily step count, resting heart rate trend, and sleep staging — three metrics that directly inform body composition decisions. Resting heart rate trending down over weeks is a solid indicator of improving cardiovascular fitness; sleep quality scoring below 70 consistently is a signal that recovery is compromised and cortisol is likely elevated, which directly blunts fat loss. The data is actionable in a way that scale weight rarely is.
Contrarian Take: The Scale Is a Terrible Metric for Most People
Here's the uncomfortable truth that most fitness content won't say directly: for the majority of people actively trying to improve body composition, the scale is the worst primary metric they could choose.
Consider what the scale does well: it measures total body mass accurately to within a few ounces. That's it. It cannot distinguish a 3 lb water shift from 3 lb of fat. It cannot tell you that the 2 lb you "gained" this week is a pound of muscle and a pound of glycogen from a well-timed carb refeed. It penalizes you for being hydrated and rewards you for being dehydrated.
The people who make the best long-term body composition progress are usually the ones who check the scale the least. They track waist circumference weekly, take photos fortnightly, and get a DEXA scan every 12 weeks. The scale becomes a sanity check — not a scorecard.
What to track instead:
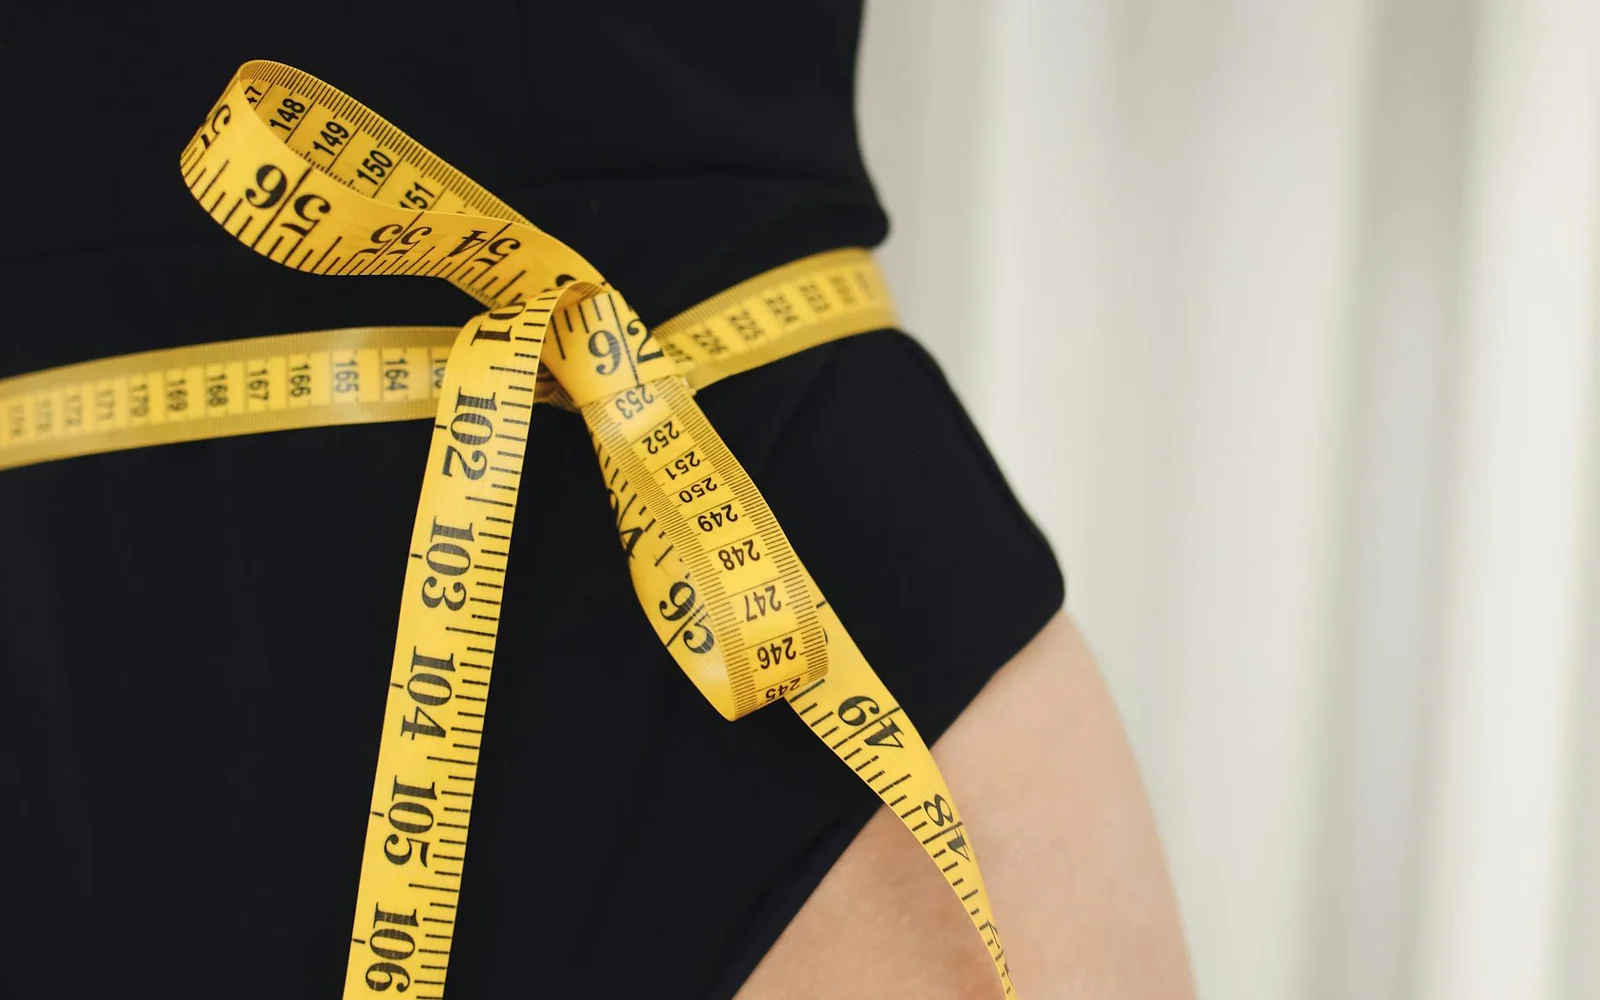
- Waist circumference at the navel (weekly, fasted, same tape)
- Progress photos in consistent lighting (every 2 weeks)
- Training performance — if you're getting stronger while in a deficit, you're keeping muscle
- How clothes fit, specifically pants waist size
- DEXA body fat % every 8–12 weeks for objective confirmation
The scale is not useless — it's just overused and misunderstood. If you check it daily and feel terrible when it goes up, it's actively working against you.
How to Actually Measure Fat Loss
If the scale is noisy, what do you use instead? Here is how the main body composition measurement tools compare:
| Method | Accuracy | Cost | Practicality | Best for | |--------|----------|------|-------------|---------| | DEXA scan | ±1–2% body fat | $50–$150/scan | Low (clinic visit) | Baseline + 12-week check-ins | | Skinfold calipers (7-site) | ±3% | $10–$20 (one-time) | Medium (needs trained tester) | Regular tracking, 2-week intervals | | Waist circumference | N/A (proxy metric) | Free | Very high | Weekly tracking of visceral fat trend | | Progress photos | Visual only | Free | Very high | Catching changes the scale hides | | Bioimpedance (smart scale) | ±3–5% | $30–$200 | Very high | Trend direction only — not absolute numbers | | Hydrostatic weighing | ±1.5–2.5% | $50–$100/test | Low (facility required) | Research-grade accuracy when DEXA unavailable |
Body-fat percentage from bioimpedance (those handheld devices and smart scales) is tempting but unreliable — the readings can swing 3–5% based on hydration alone. Use them for trend direction, not absolute numbers.
To get the most honest picture of your actual progress, pair waist measurements with progress photos. That combination catches what the scale systematically hides and costs nothing.

Amazon · Affiliate
Etekcity Digital Food Scale (0.1g precision)
4.7
Measures in grams, ounces, pounds, and milliliters. Tare function, backlit display, auto-off. Essential for accurate macro tracking.
$10–$16Check Price on Amazon
A food scale is the measurement tool that actually moves the needle during a cut. Weighing your food in grams — rather than estimating cups and handfuls — closes the gap between what you think you're eating and what you're actually eating. Research consistently shows people underestimate caloric intake by 20–40% when eyeballing portions. For a 2,000-calorie target, that error alone accounts for the entire deficit most people are trying to create.
Final Thoughts
Fat loss vs weight loss is the difference between a diet that works and a diet that just makes you smaller. The scale tells you one number; your body composition — the ratio of fat to lean mass — tells you whether the number you lost was the right kind. Protein, resistance training, a modest deficit, and honest measurement are the four levers that keep fat coming off while muscle stays put.
The LBE Framework makes this actionable: pick a lever (appropriate deficit), build protection around it (protein + lifting), and use real evidence (waist tape, photos, DEXA) to verify you're moving in the right direction. The scale can stay on the floor as a secondary sanity check.
If you're starting a cut, pick one tracking tool and one measurement tool this week — a fitness tracker on your wrist and a food scale on the counter will do more for your 12-week outcome than any new cardio program. Browse our full supplement and gear recommendations to round out what you need, and focus on the numbers that actually track the body you're trying to build.
Affiliate disclosure: Some links in this article are affiliate links. If you purchase through them, we may earn a small commission at no extra cost to you. We only recommend products we genuinely believe in.
About the author
Nathan reviews the research, tests the tools, and writes the guides at LeanBodyEngine — evidence-first, no sponsored content, no supplement shilling.
Related articles


Subscribe
Never miss a new article
Get an email whenever we publish a new fitness guide, supplement review, or workout plan. One short email per post — that's it.
Unsubscribe anytime. We only email when there's a new post.